
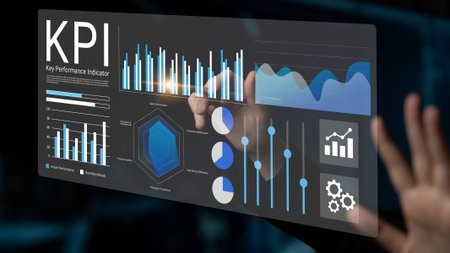
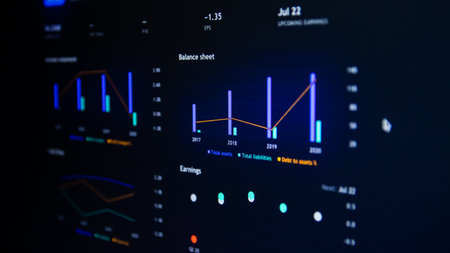
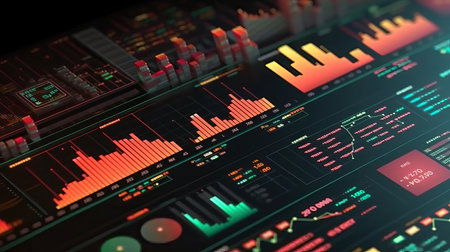
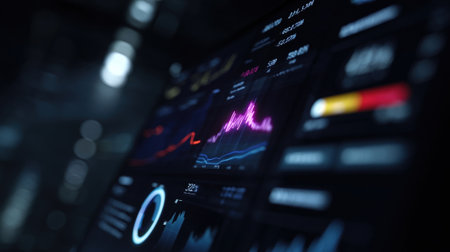
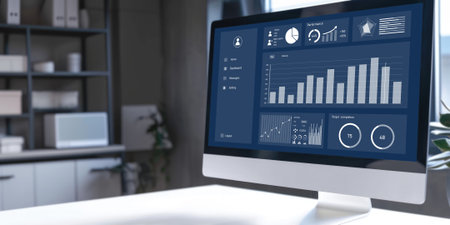
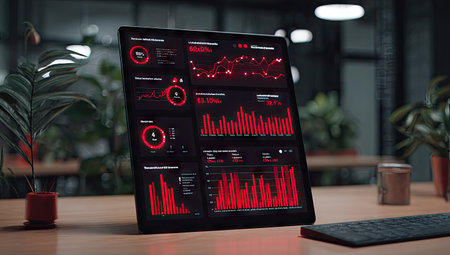
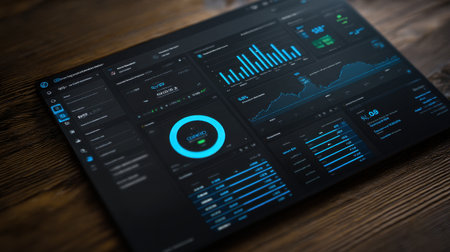
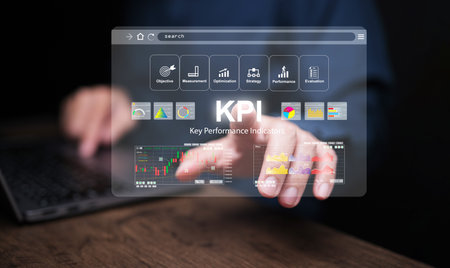
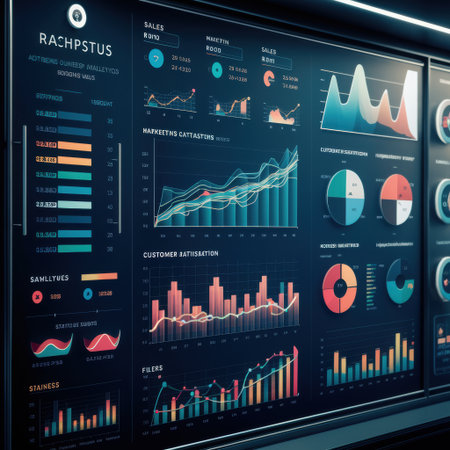
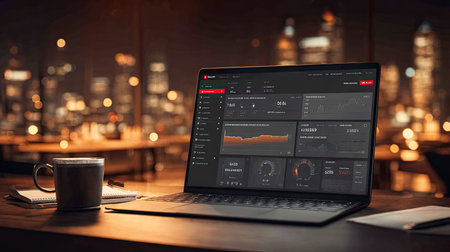
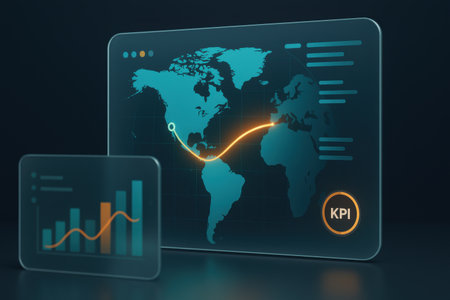
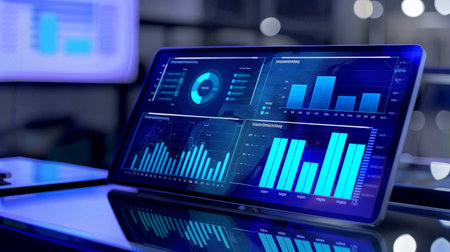
A digital dashboard showcasing key performance indicators with various graphs and metrics for enhanced data visualization and analytical decision-making in business.
Коллекция по умолчанию
Коллекция по умолчанию
Создать новую
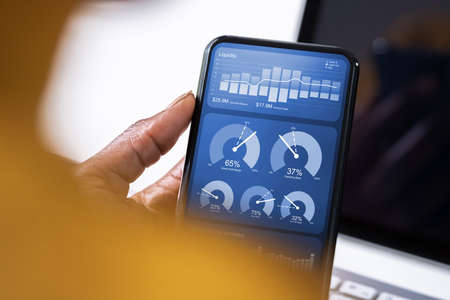
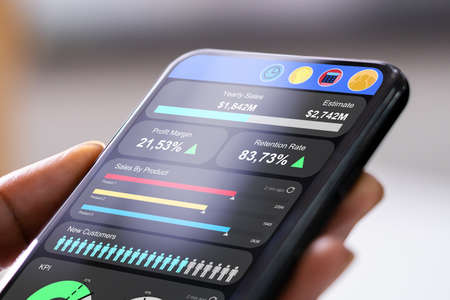
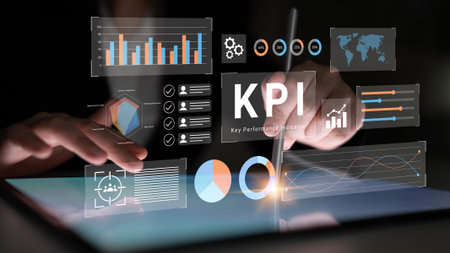
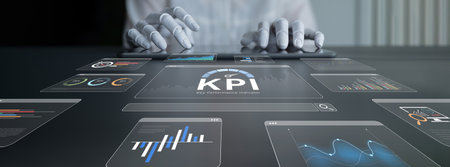
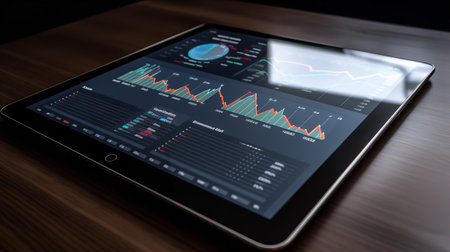
African Advisor Using KPI Dashboard With Financial Analytics Graphs
Коллекция по умолчанию
Коллекция по умолчанию
Создать новую
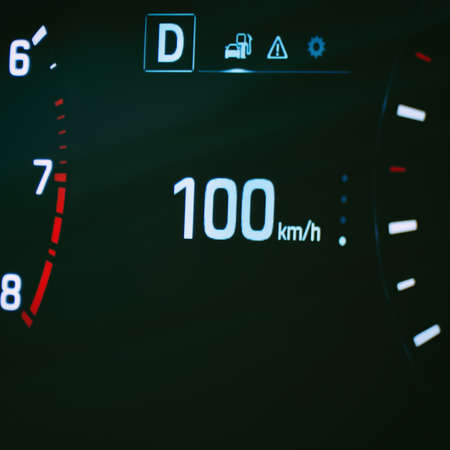
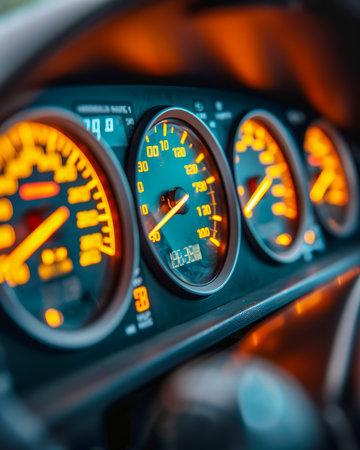
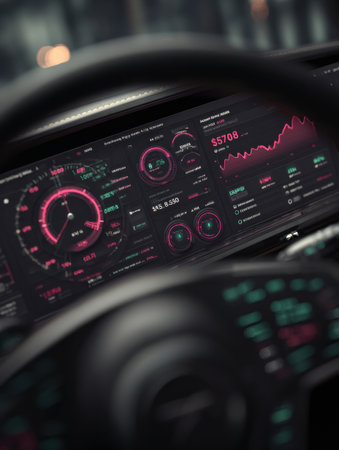
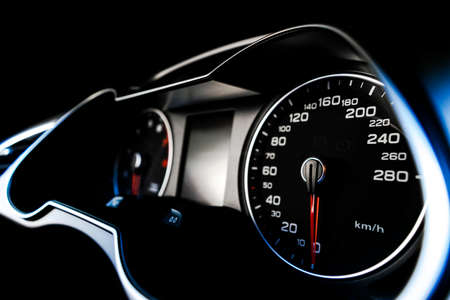
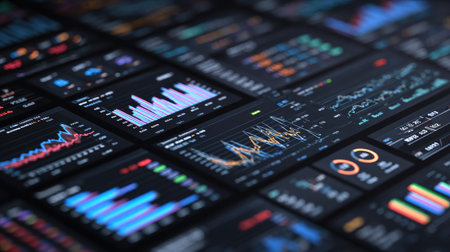
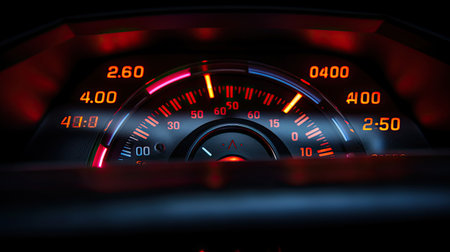
Speedometer in the car on the dashboard. The cars speedometer shows 100 mph
Коллекция по умолчанию
Коллекция по умолчанию
Создать новую
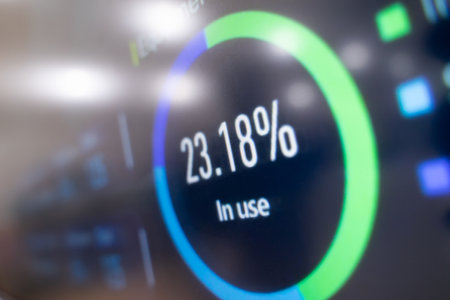
Loading progress bar Load or download and upload circle and speed loader icon. Status or loader progress percentage bar for website or internet page in neon gradient.
Коллекция по умолчанию
Коллекция по умолчанию
Создать новую

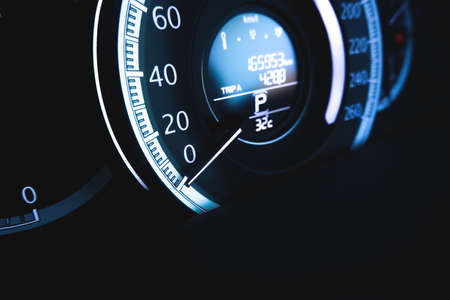
Close up shot with the digital speedometer of a car.
Коллекция по умолчанию
Коллекция по умолчанию
Создать новую
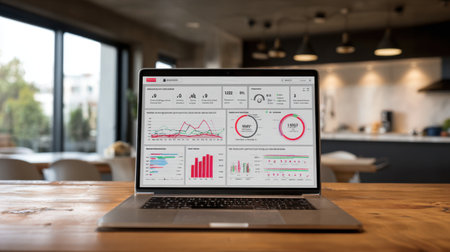
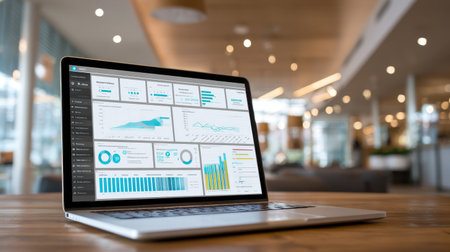
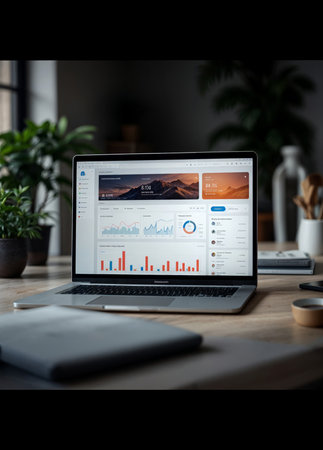
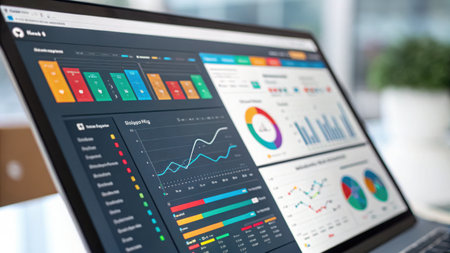
A sleek laptop showcasing a detailed business analytics dashboard filled with graphs and charts, set in a stylish office environment emphasizing modern workspace trends.
Коллекция по умолчанию
Коллекция по умолчанию
Создать новую
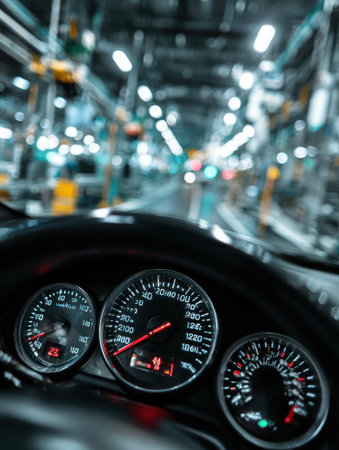
Car dashboard with lit speedometer and tachometer in factory setting
Коллекция по умолчанию
Коллекция по умолчанию
Создать новую

Speedometer in the car on the dashboard at night. Selective focus
Коллекция по умолчанию
Коллекция по умолчанию
Создать новую

Speedometer in the car on the dashboard
Коллекция по умолчанию
Коллекция по умолчанию
Создать новую
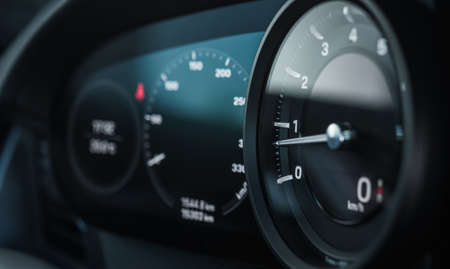
Rev Counter Tachometer Instrument in Modern Car Dashboard. Revolution-Counter Measuring Device. Automotive and Transportation Technology.
Коллекция по умолчанию
Коллекция по умолчанию
Создать новую

Color car air conditioning buttons close up view inside a car. Car temperature conditioner dashboard panel.
Коллекция по умолчанию
Коллекция по умолчанию
Создать новую
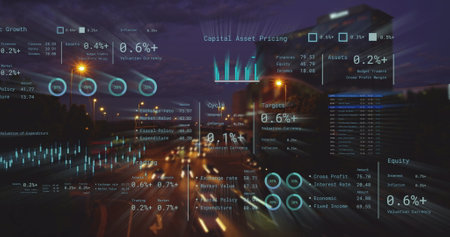
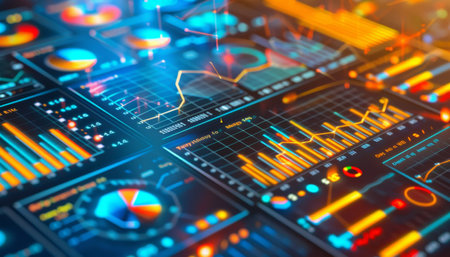
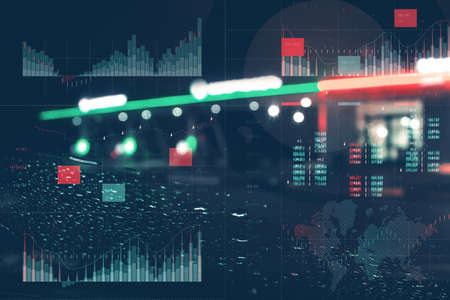
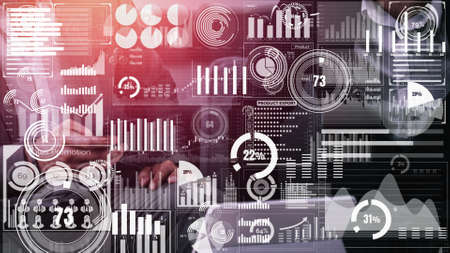
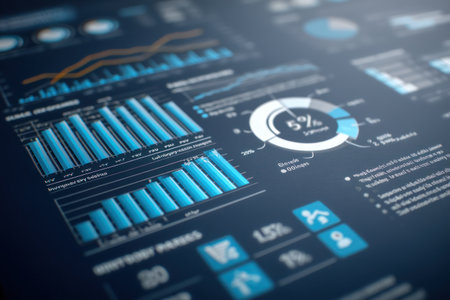
Image of financial data processing over city. Global networks, business, finances, computing and data processing concept digitally generated image.
Коллекция по умолчанию
Коллекция по умолчанию
Создать новую
Car dashboard lights and road background in the night.Close up.
Коллекция по умолчанию
Коллекция по умолчанию
Создать новую
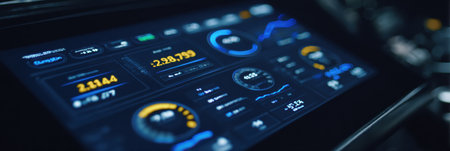
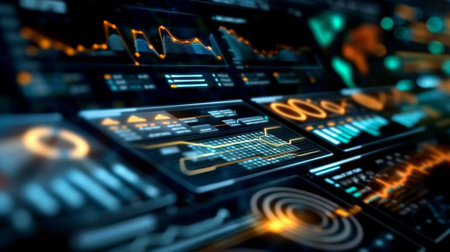
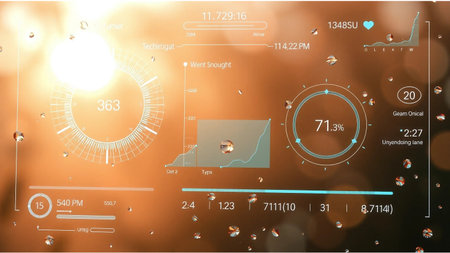
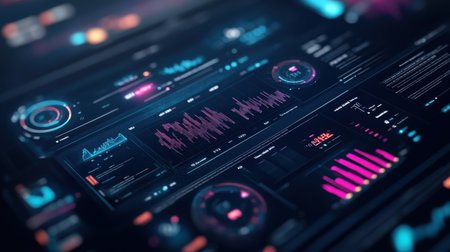
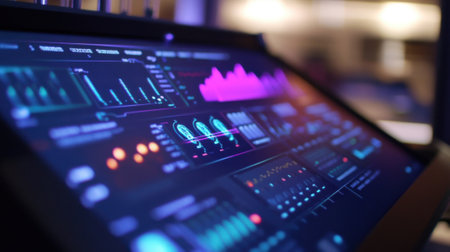
Futuristic dashboard with financial data on a dark background. The concept of business analysis and planning.
Коллекция по умолчанию
Коллекция по умолчанию
Создать новую
Apple Computers website. Apple Computers is an American multinational technology company headquartered in Cupertino, California.
Коллекция по умолчанию
Коллекция по умолчанию
Создать новую
Stock market data on the screen of a modern computer. Business concept
Коллекция по умолчанию
Коллекция по умолчанию
Создать новую

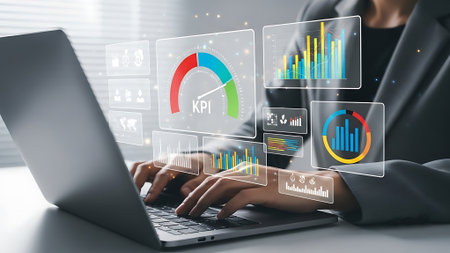
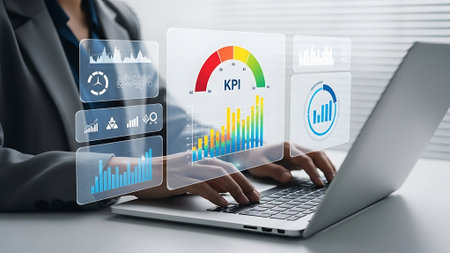
Businessman Holding KPI Icons, Performance Metrics and Data Analysis, Strategic Planning and Goal
Коллекция по умолчанию
Коллекция по умолчанию
Создать новую
Stock market data on monitor. Business financial graph on monitor screen. Stock market data on monitor. Business financial graph on monitor.
Коллекция по умолчанию
Коллекция по умолчанию
Создать новую
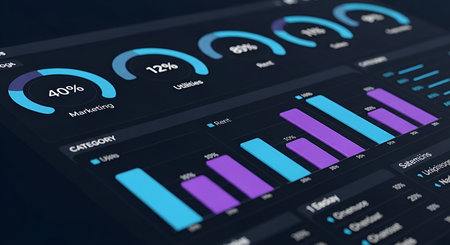
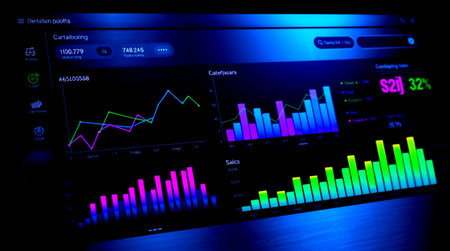
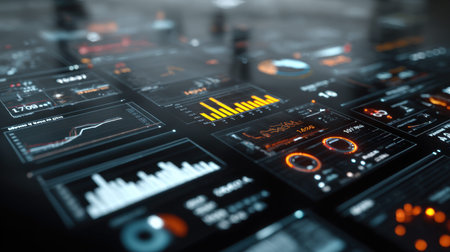
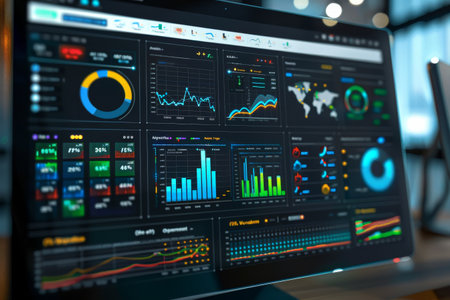
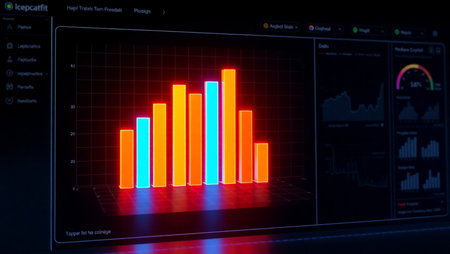
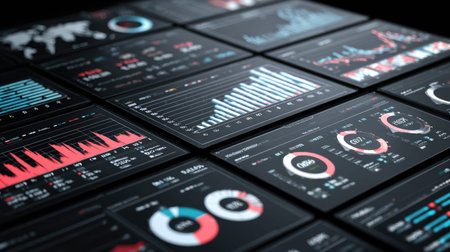
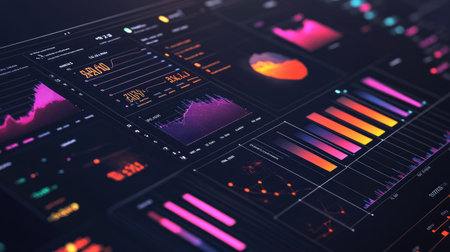
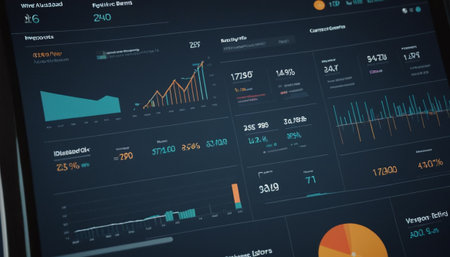
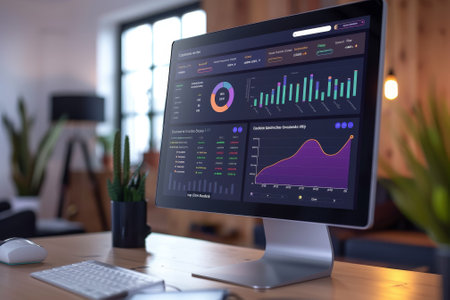
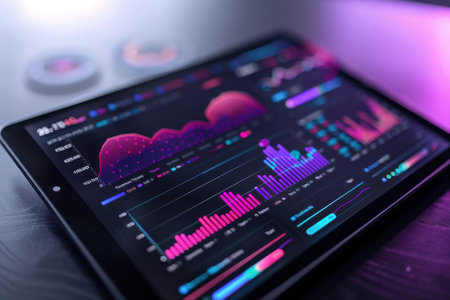
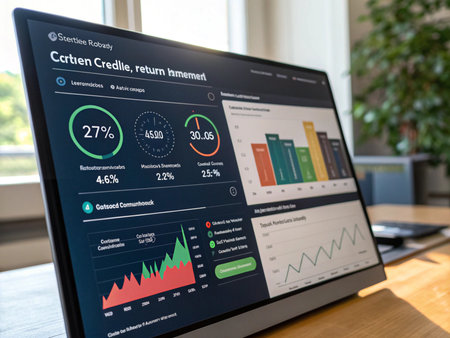
A close-up view of a dark digital dashboard displaying various charts and graphs. Circular progress indicators show percentages like 40% for Marketing and 12% for Utilities. Bar charts, colored in blue and purple, represent data categories such as Rent and Sales. The interface is sleek and modern, suggesting financial or business analysis.
Коллекция по умолчанию
Коллекция по умолчанию
Создать новую
African Advisor Using KPI Dashboard With Financial Analytics Graphs
Коллекция по умолчанию
Коллекция по умолчанию
Создать новую
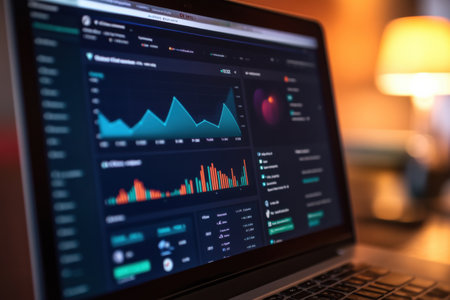
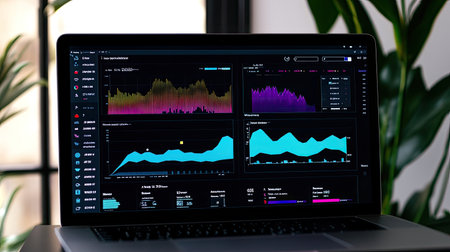
Graphs and charts representing financial metrics and trends are shown on a sleek laptop in a warmly lit room during the evening.
Коллекция по умолчанию
Коллекция по умолчанию
Создать новую
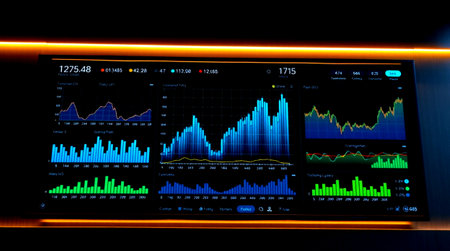
Blurry speed meter for abstract background
Коллекция по умолчанию
Коллекция по умолчанию
Создать новую
Smartphone screen with stock market data on display. 3D rendering.
Коллекция по умолчанию
Коллекция по умолчанию
Создать новую

Close up shot with the digital dashboard of a car.
Коллекция по умолчанию
Коллекция по умолчанию
Создать новую
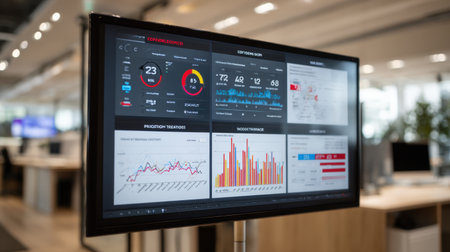
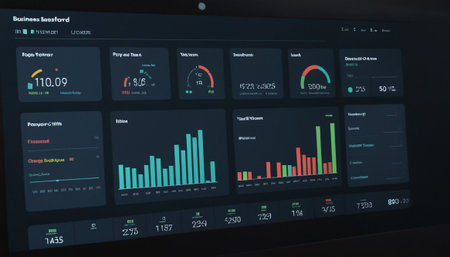
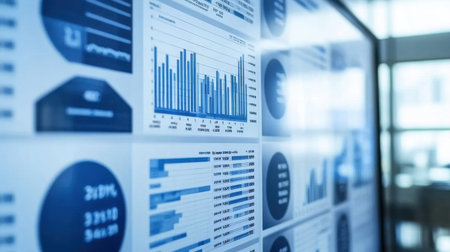
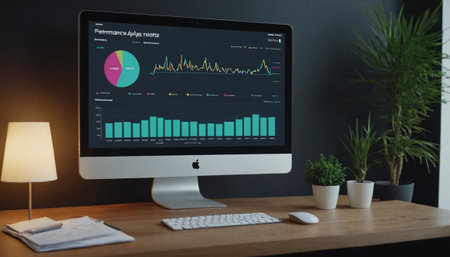
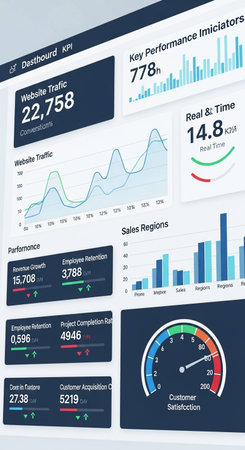
A detailed view of a professional business dashboard showcasing various analytical data on a digital screen in a contemporary office setting, perfect for presentations.
Коллекция по умолчанию
Коллекция по умолчанию
Создать новую
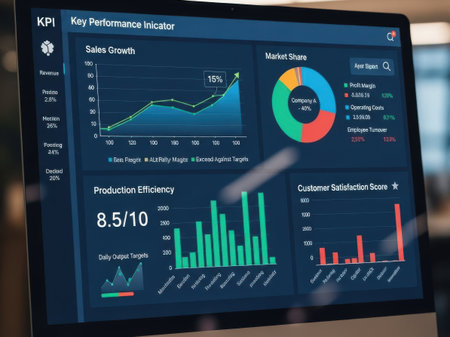
Strategic Business Insights Visualize Your Success with KPI Metrics Dashboard
Коллекция по умолчанию
Коллекция по умолчанию
Создать новую
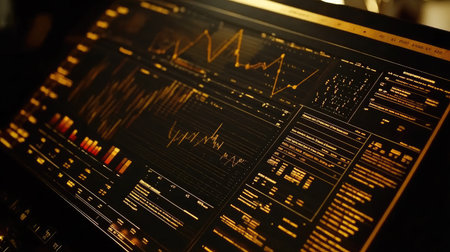
Technical price graph and indicator, red and green candlestick chart on screen, market volatility, up and down trend. Stock trading, crypto currency, ultra wide format, by ai generative
Коллекция по умолчанию
Коллекция по умолчанию
Создать новую
Futuristic user interface with charts and diagrams. 3d rendering
Коллекция по умолчанию
Коллекция по умолчанию
Создать новую
Close-up of hands using a digital tablet to explore key performance indicators with interactive graphs and charts for data-driven decision-making in business.
Коллекция по умолчанию
Коллекция по умолчанию
Создать новую

Laptop showcasing dynamic data visualizations with colorful graphs. The device is placed amidst flowers under illuminated skies at night. Clear view of the screen highlights analytical insights.
Коллекция по умолчанию
Коллекция по умолчанию
Создать новую
Dynamic and innovative data visualization display showcasing various metrics and trends, ideal for business intelligence, analytics, and performance analysis. Designed for clarity and engagement.
Коллекция по умолчанию
Коллекция по умолчанию
Создать новую
Gas station with fuel dispensers on technological background. Graph of rising prices for gasoline and fuel
Коллекция по умолчанию
Коллекция по умолчанию
Создать новую
A computer screen displaying a plethora of data and information related to key performance indicators, A digital dashboard tracking key performance indicators
Коллекция по умолчанию
Коллекция по умолчанию
Создать новую
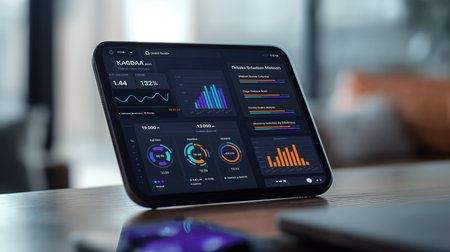
A sleek laptop shows a modern digital dashboard with colorful data visualizations and analytics, set in a contemporary workspace, perfect for business insights.
Коллекция по умолчанию
Коллекция по умолчанию
Создать новую
Stock market chart on LED display, stock market data analysis concept.
Коллекция по умолчанию
Коллекция по умолчанию
Создать новую
A futuristic digital interface displaying a dual timeline one side illustrating live data analytics with vibrant graphs while the other side visualizes trends from historical data highlightin
Коллекция по умолчанию
Коллекция по умолчанию
Создать новую
Close up View of Illuminated Car Dashboard Gauges with Focus on Speedometer and RPM Vehicle Interior Details in Warm Light AI Generative
Коллекция по умолчанию
Коллекция по умолчанию
Создать новую
Finance graph on the monitor of a computer monitor. 3d rendering
Коллекция по умолчанию
Коллекция по умолчанию
Создать новую
A modern office scene featuring a digital display of business analytics, showcasing various statistical graphs and charts vital for decision-making and strategic planning.
Коллекция по умолчанию
Коллекция по умолчанию
Создать новую

Futuristic car showing its navigation system and digital dashboard while driving through a city at night
Коллекция по умолчанию
Коллекция по умолчанию
Создать новую
Modern Laptop Displaying Data Analysis Dashboards in a Bright Cafe Environment with a Cozy and Inviting Atmosphere for Business Professionals
Коллекция по умолчанию
Коллекция по умолчанию
Создать новую
Explore a modern data visualization dashboard showcasing dynamic charts and graphs designed for business analysis, metrics evaluation, and insightful decision-making.
Коллекция по умолчанию
Коллекция по умолчанию
Создать новую
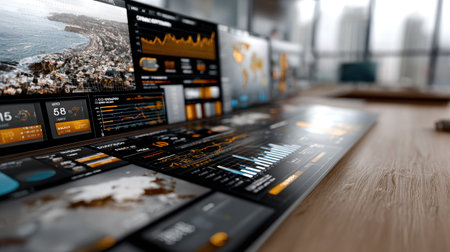
A sleek and modern data dashboard showcasing various analytical charts and statistics set against a scenic urban view, ideal for business insights.
Коллекция по умолчанию
Коллекция по умолчанию
Создать новую
An overview of multiple 3D pie charts displayed on a digital dashboard, each representing different data sets and comparisons for comprehensive analysis.
Коллекция по умолчанию
Коллекция по умолчанию
Создать новую
Digital screen showcases a crypto gambling dashboard with vibrant stats and analytics, designed for real-time monitoring and decision making.
Коллекция по умолчанию
Коллекция по умолчанию
Создать новую
An engaging digital dashboard displaying colorful charts and graphs for data analysis. Perfect for tech, business presentations, and analytics projects.
Коллекция по умолчанию
Коллекция по умолчанию
Создать новую
Businessman analyzing investment charts on computer screen in office. Accounting and finance concept
Коллекция по умолчанию
Коллекция по умолчанию
Создать новую
Analysis laptop data working with kpi graphs, charts, business strategy, and marketing planning. Background represents monitoring performance and growth.
Коллекция по умолчанию
Коллекция по умолчанию
Создать новую
Close-up of a sophisticated data visualization dashboard featuring various graphs and analytics for monitoring performance and trends in real-time.
Коллекция по умолчанию
Коллекция по умолчанию
Создать новую
Unleashing Business Insights: Exploring a Virtual Screen with an Interactive Business Intelligence Analyst Dashboard and Spectacular Big Data Graphs and Charts
Коллекция по умолчанию
Коллекция по умолчанию
Создать новую
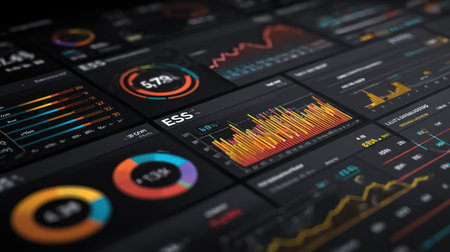
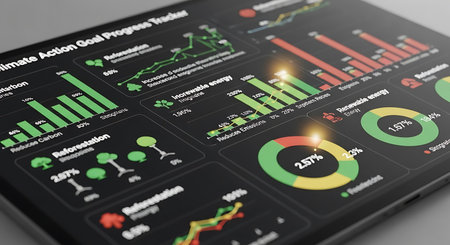
A stylized infographic element showing esg metric and compliance chart on sleek dark background with vibrant data visualization and dynamic graphs
Коллекция по умолчанию
Коллекция по умолчанию
Создать новую
Close-up of graphs and charts on computer screen. Business concept
Коллекция по умолчанию
Коллекция по умолчанию
Создать новую
Business data dashboard provide brisk business intelligence analytic for marketing strategy planning
Коллекция по умолчанию
Коллекция по умолчанию
Создать новую

Car miles speedometer close up.
Коллекция по умолчанию
Коллекция по умолчанию
Создать новую
Close up shot of a speedometer in a car. Car dashboard. Dashboard details with indication lamps.Car instrument panel. Dashboard with speedometer, tachometer, odometer. Car detailing. Modern interior
Коллекция по умолчанию
Коллекция по умолчанию
Создать новую

Futuristic HUD interface on dark background 3D rendering toned image double exposure
Коллекция по умолчанию
Коллекция по умолчанию
Создать новую
An AI assistant manages a business intelligence dashboard, tracking Key Performance Indicators (KPI) in real-time. This smart system visualizes data and measures performance.
Коллекция по умолчанию
Коллекция по умолчанию
Создать новую
A computer monitor displays a graph with a purple line and a green line
Коллекция по умолчанию
Коллекция по умолчанию
Создать новую
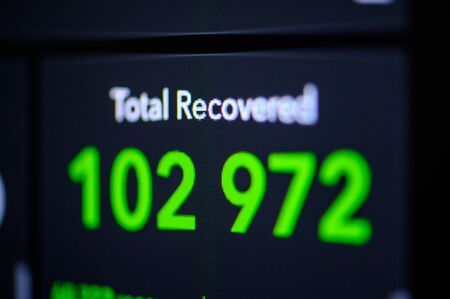
Green Number of Total Recovered from . Coronavirus COVID-19 global cases Map. Red Dot showing the number of infected. Johns Hopkins University map on monitor display.
Коллекция по умолчанию
Коллекция по умолчанию
Создать новую
High-resolution image of a sleek data dashboard on a computer monitor showcasing financial analysis with various statistical graphs and trends.
Коллекция по умолчанию
Коллекция по умолчанию
Создать новую
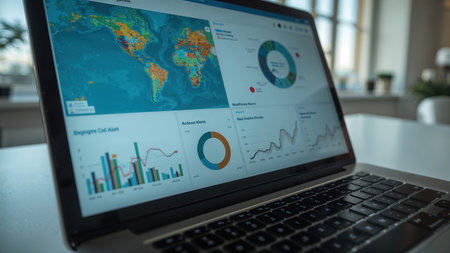
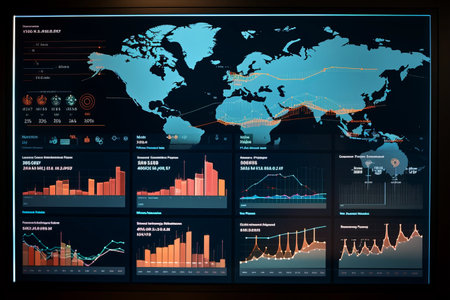
Open laptop showing a data analytics dashboard with visualizations including charts, graphs, and a world map. Bright office background with natural light.
Коллекция по умолчанию
Коллекция по умолчанию
Создать новую
Intelligent technology interface for presentation. Network management data screen with colored charts and diagrams with steps, options, parts or processes. Infographic digital illustration.
Коллекция по умолчанию
Коллекция по умолчанию
Создать новую
A digital tablet showcases complex data visualizations with red graphics against a dark background. The scene suggests an indoor setting, possibly an office, with a wooden surface and blurred background elements. The image may serve for technology-related content, business analytics, or other commercial purposes.
Коллекция по умолчанию
Коллекция по умолчанию
Создать новую
A tablet displays a colorful graph with a purple background
Коллекция по умолчанию
Коллекция по умолчанию
Создать новую
Speedometer kilometer per hour on dashboard of the automobile
Коллекция по умолчанию
Коллекция по умолчанию
Создать новую
Conceptual business dashboard for financial data analysis . 3D render computer graphic .
Коллекция по умолчанию
Коллекция по умолчанию
Создать новую
A sleek data dashboard showcasing various analytics and performance metrics. The design features graphs and charts displayed on a tablet, enhancing productivity.
Коллекция по умолчанию
Коллекция по умолчанию
Создать новую
A close-up of graphs and charts displayed on a touch screen tablet, representing data analysis in business operations.
Коллекция по умолчанию
Коллекция по умолчанию
Создать новую
A vibrant abstract digital visualization displaying various colorful graphs and charts that illustrate financial trends and business analytics for deep insights.
Коллекция по умолчанию
Коллекция по умолчанию
Создать новую
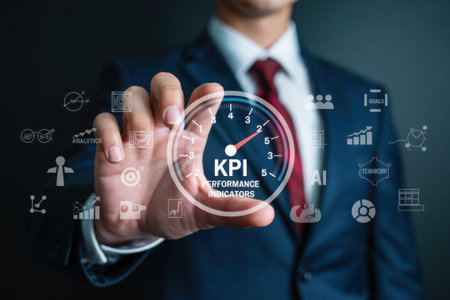
A person in a suit holds out a hand presenting a digital KPI dashboard. This image represents business performance tracking, data analysis, and strategic goal achievement.
Коллекция по умолчанию
Коллекция по умолчанию
Создать новую
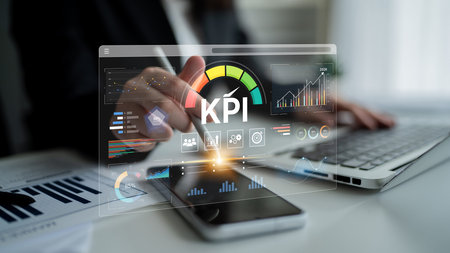
KPI key performance indicator. A businessman with computer notebook tapping on virtual screen to use KPIs to measure progress of his business, project, or work over time to reach the goals
Коллекция по умолчанию
Коллекция по умолчанию
Создать новую

Modern illuminated green car control panel, dashboard display.
Коллекция по умолчанию
Коллекция по умолчанию
Создать новую
Dashboard with charts and diagrams. Infographics elements. Vector illustration.
Коллекция по умолчанию
Коллекция по умолчанию
Создать новую
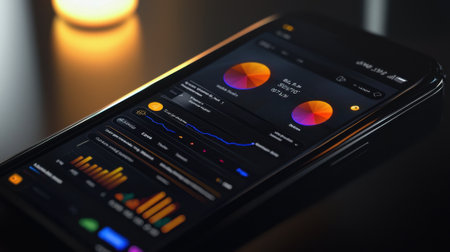
A sleek smartphone shows vibrant data charts and graphs against a dark background. The device captures attention with its user-friendly interface and illuminated ambiance.
Коллекция по умолчанию
Коллекция по умолчанию
Создать новую
Digital Dashboard Interface
Коллекция по умолчанию
Коллекция по умолчанию
Создать новую
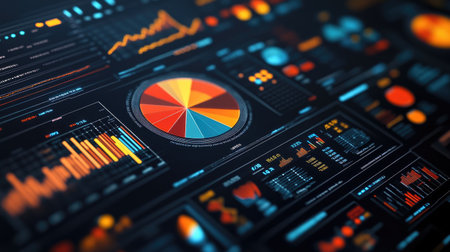
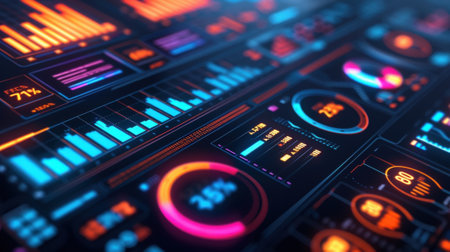
This high-resolution image captures a dynamic digital dashboard showcasing a multitude of intricate data visualizations. Multiple charts, graphs, and indicators present financial performance metrics, market trends, and growth projections in a clear and organized manner. The vibrant colors and detailed graphics emphasize the power of data analytics for informed decision-making in business and technology.
Коллекция по умолчанию
Коллекция по умолчанию
Создать новую
Digital dashboard highlights real-time statistics and performance indicators for crypto gambling activities, showcasing an interactive user interface.
Коллекция по умолчанию
Коллекция по умолчанию
Создать новую
A business intelligence dashboard displaying various Key Performance Indicators (KPI). The data visualization tracks business metrics and measures performance against goals.
Коллекция по умолчанию
Коллекция по умолчанию
Создать новую

Low angle camera shot of african american employee alone at work, enjoying music while checking financial data charts on computer. Bookkeeper with headphones on working in office during nightshift
Коллекция по умолчанию
Коллекция по умолчанию
Создать новую
This image presents data visualizations featuring blue charts, graphs, and diagrams on a digital interface. The composition uses an overhead perspective and soft lighting to highlight the details. Suitable for commercial applications, the image can be used for presentations and illustrative purposes related to business.
Коллекция по умолчанию
Коллекция по умолчанию
Создать новую

Laptop with stock market data on screen, stock market data concept
Коллекция по умолчанию
Коллекция по умолчанию
Создать новую
Closeup of a digital dashboard displaying realtime equipment metrics with colorful graphs and charts representing production levels and efficiency
Коллекция по умолчанию
Коллекция по умолчанию
Создать новую
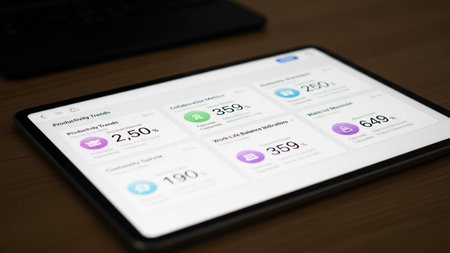
This image shows a tablet device displaying a digital dashboard with various health metrics. The dashboard includes sections for productivity trends, caloric intake, sleep monitoring, work-life balance scores, and step counts. Each section has a visual representation, such as graphs and icons, to provide a clear overview of the user's health and productivity data.
Коллекция по умолчанию
Коллекция по умолчанию
Создать новую
Analyzing key performance indicator data on laptop display. Person typing and analyzing graphs and charts on computer. Business analysis with charts and graphs in background.
Коллекция по умолчанию
Коллекция по умолчанию
Создать новую
digital business technology dashboard with graph
Коллекция по умолчанию
Коллекция по умолчанию
Создать новую

dashboard image of inside car with bokeh on evening time for background
Коллекция по умолчанию
Коллекция по умолчанию
Создать новую
A laptop with a data dashboard sits on a desk at night with city lights.
Коллекция по умолчанию
Коллекция по умолчанию
Создать новую
Futuristic virtual graphic touch user interface HUD. Elements for your design
Коллекция по умолчанию
Коллекция по умолчанию
Создать новую

speedometer and dashboard car black and white photography
Коллекция по умолчанию
Коллекция по умолчанию
Создать новую
Laptop screen with financial graphs and charts on the table in office
Коллекция по умолчанию
Коллекция по умолчанию
Создать новую

Image of statistics recording and scopes scanning on screens over grid. digital interface, global data processing and technology concept digitally generated image.
Коллекция по умолчанию
Коллекция по умолчанию
Создать новую
Laptop screen with financial charts and graphs on the table in office
Коллекция по умолчанию
Коллекция по умолчанию
Создать новую
Futuristic interface with graphs and charts. 3d rendering.
Коллекция по умолчанию
Коллекция по умолчанию
Создать новую

beautiful background of night lights, bokeh
Коллекция по умолчанию
Коллекция по умолчанию
Создать новую
Future of work trends Data analytics dashboard displayed on a laptop screen showcasing various charts and graphs.
Коллекция по умолчанию
Коллекция по умолчанию
Создать новую
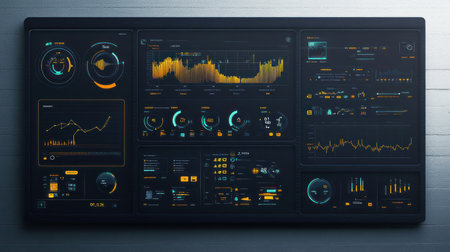
A highly detailed dashboard showcases various data visualizations and metrics. The vibrant neon colors enhance the futuristic aesthetic, creating a tech-savvy atmosphere.
Коллекция по умолчанию
Коллекция по умолчанию
Создать новую
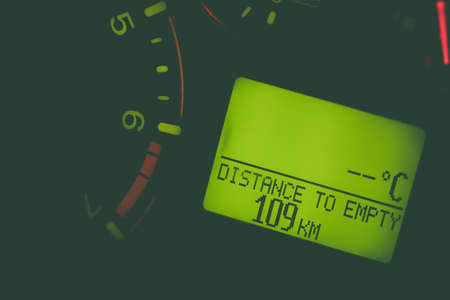
Electronic display of a car showing the distance to empty.
Коллекция по умолчанию
Коллекция по умолчанию
Создать новую
graph and diagram finance technology dashboard on screen
Коллекция по умолчанию
Коллекция по умолчанию
Создать новую
car warning lights
Коллекция по умолчанию
Коллекция по умолчанию
Создать новую
Analyzing data on interactive digital screen
Коллекция по умолчанию
Коллекция по умолчанию
Создать новую
Legion-Media
Создайте свои проекты на основе качественных стоковых фотографий и видео.


Copyright © Legion-Media.